

We are proud to say that these posts are not sponsored. Our editorial team of Bobbie moms and writers personally select each featured product. If you buy something through our links, we may earn an affiliate commission, at no cost to you.
You likely leave every well check with your infant’s latest growth chart numbers, but do you really need to be loading that baby growth chart calculator on your phone at 3 am in between visits?
As a pediatric dietitian, interpreting growth charts for the boys and girls I see in my practice is one of several tools I use to determine whether a child might require a feeding intervention. But as an anxious parent of two young children myself and a woman with many similarly anxious mom friends, I know that growth chart anxiety can dominate new parenthood.
“When my girls were babies, I was anxious about their weight at every doctors’ visit.” says Dani, a mom of three. “I knew they were growing but were the babies eating enough? Are they growing properly? I remember always asking the doctor to print their growth charts so I could see for myself.”
Yet infant growth charts are not actually meant to deliver an A+ vs. C- as to whether babies are growing properly. They’re a tool to track a child’s growth over time, but a dip up or down doesn’t necessarily indicate a growth issue. “I find that the general population of parents may become overwhelmed by the information of a growth curve as it’s not easy to understand the data that it presents,” says Amna Husain, MD, FAAP and Bobbie Medical Advisor. It’s less of a “best out of 100” like a test score. Instead, it provides a trend for your child. Normal human growth is pulsatile. Growth can also be seasonal. Growth velocity, or the change in growth over time, is a very sensitive and useful tool.”
- Baby growth chart history
- Growth chart terms and definitions
- Biases of the Baby Growth Chart
- Pros and Cons of the Baby Growth Chart
- Typical growth expectations for healthy boys and healthy girls
- Do breastfed babies gain weight slower?
- Baby size by week
- Are baby growth charts out of date?
- How growth charts affect parents’ mental health
- How growth charts cause anxiety
Baby growth chart history
Growth charts didn’t exist before the 1970s. In the late 70s, the Centers for Disease Control produced the first set of growth charts intended for clinical use, but the 0-12 month charts were based on data from predominantly white, formula-fed infants. Since this wasn’t representative of the growth patterns of all American infants, these charts were revised in 2000 to include data from a more diverse pool of children, including both breast and formula fed infants.
Yet just a few years later, in 2006, the World Health Organization produced their own set of growth charts. “The WHO curves were derived from 8440 healthy breast-fed infants and young children from six participating countries – Brazil, Ghana, India, Norway, Oman, and the United States,” says Dr. Husain. “The study population was actually chosen to reflect a standard for children living under what we describe as “optimal environmental conditions,” and they are intended to be used for all children, regardless of ethnicity, socioeconomic status, and type of feeding.” Since each set of charts displayed different growth patterns, both families and medical professionals experienced confusion. To end the confusion, in 2010, the CDC recommended that clinicians use the WHO charts from ages 0 to 24 months and switch to the CDC’s charts from ages 2 to 19.
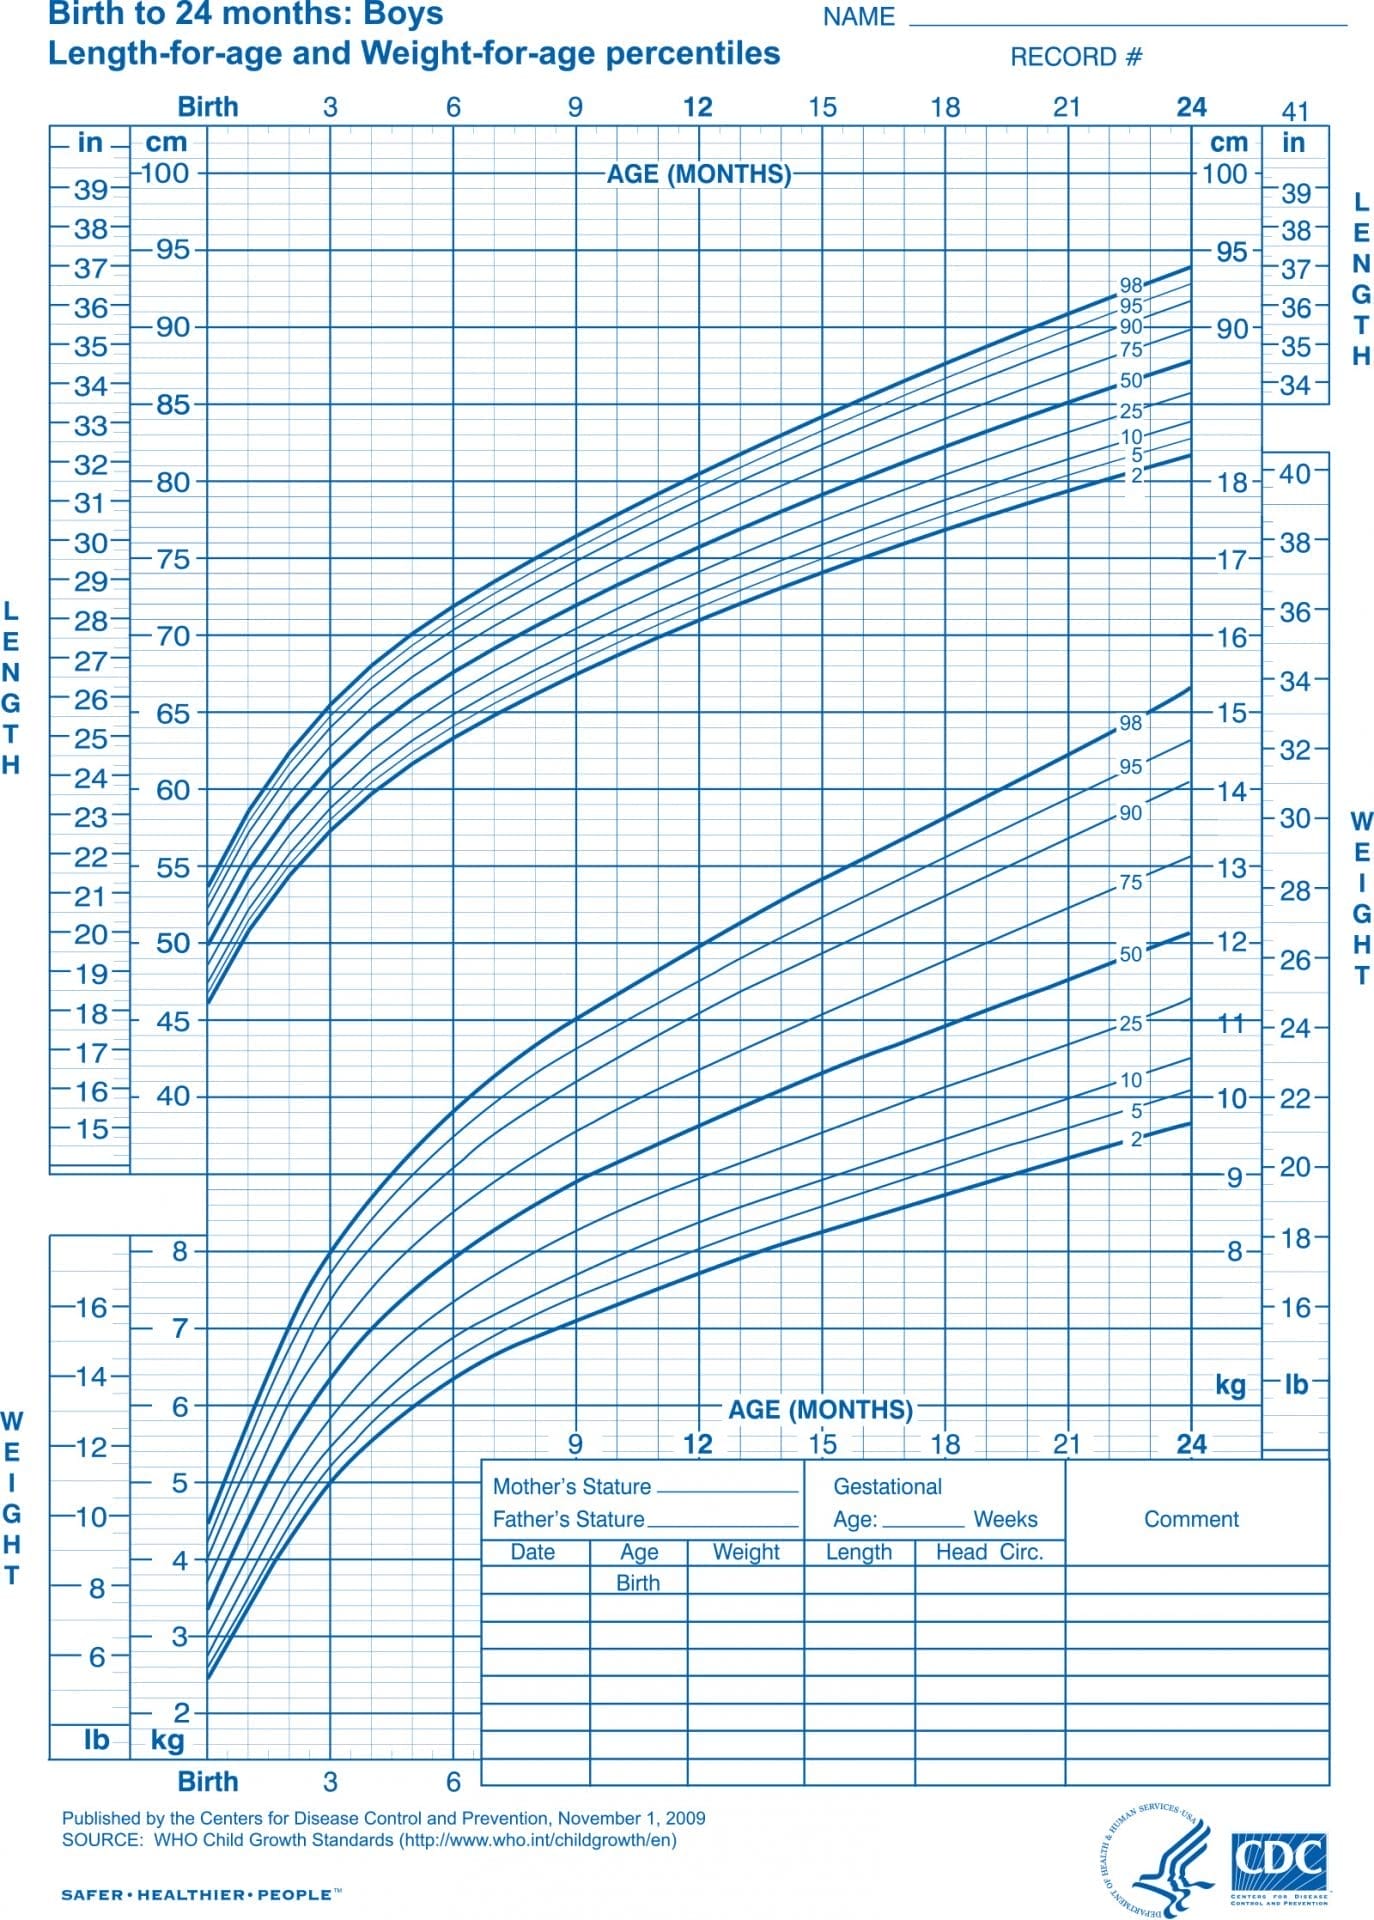
WHO baby growth charts:
Attached below are the WHO baby growth charts to be used for ages 0-24 months. The left is the WHO growth chart for boys and the right is the WHO growth chart for girls.

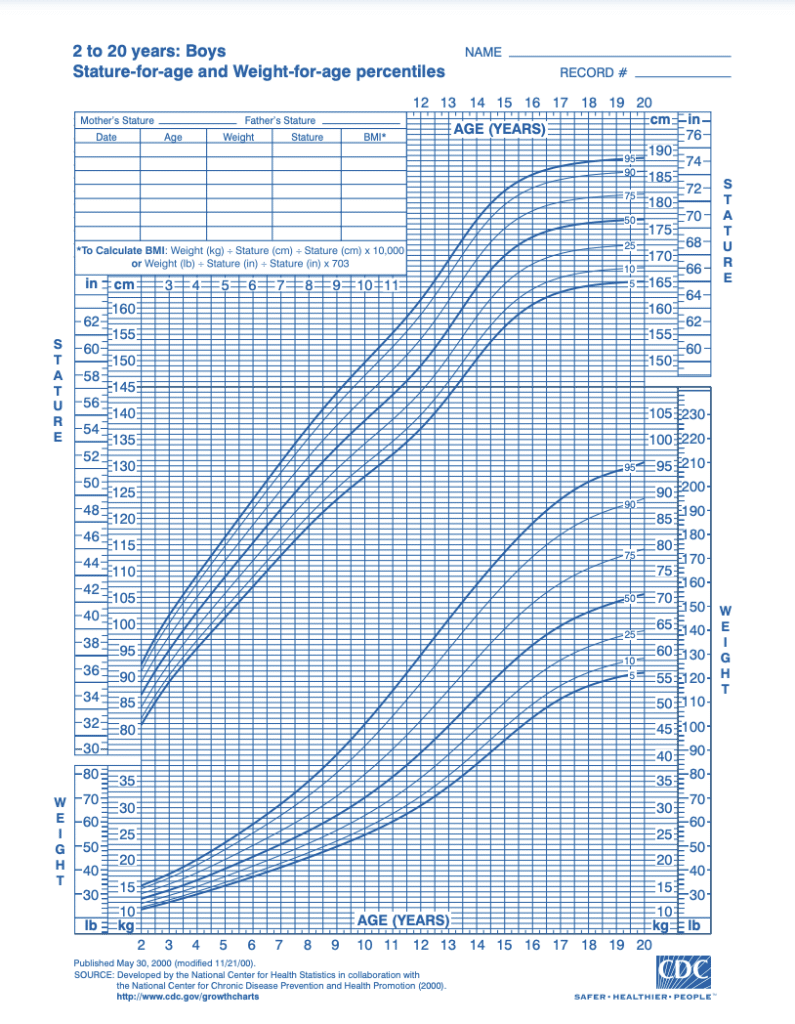
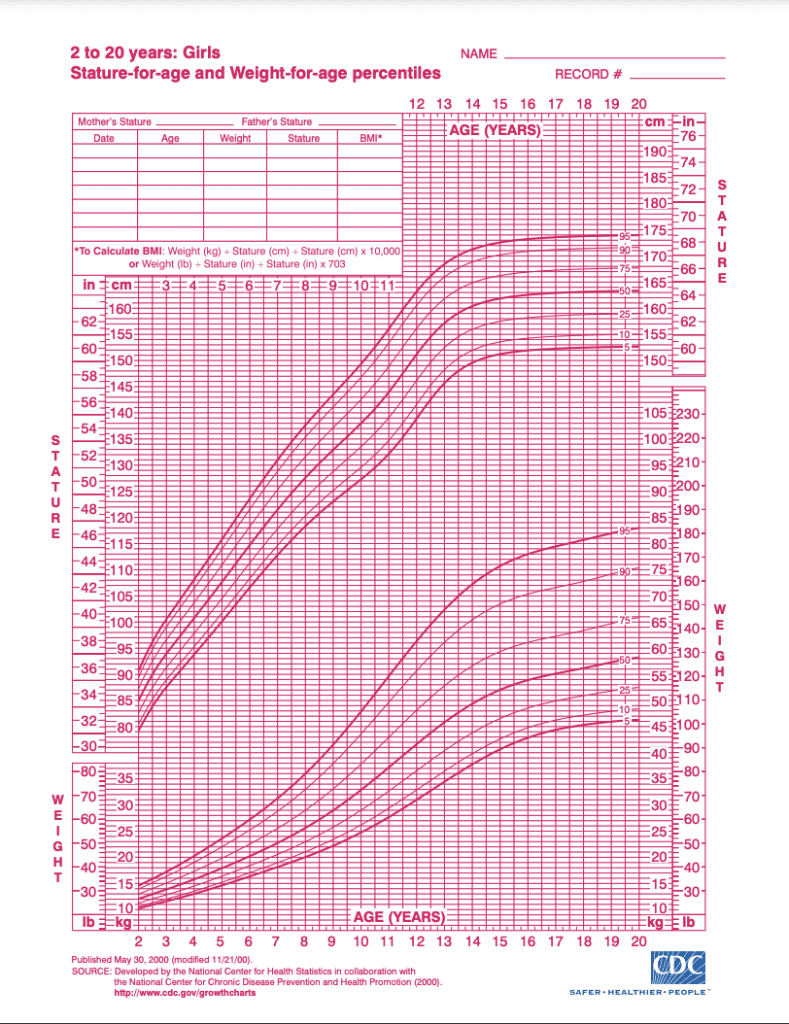
CDC growth charts for boys and girls:
Attached below are the CDC baby growth charts to be used for ages 2-20. The left is the CDC growth chart for boys and the right is the CDC growth chart for girls.
Growth chart terms and definitions
So what does all this mean for your child? First of all, please don’t read too much into this business about “optimal” growth conditions, as it will surely only lead to additional anxiety. Unlike your 9th grade biology test, we’re not looking for a score of 100% here, nor does a child landing square in the 50th percentile mean that their growth is ideal.
Growth chart curves represent how many other children are larger than your child and how many are smaller. So if your child measures at the 25th percentile, about 25% of other children are smaller than your child at the age the measurement was taken and 75% are bigger. But remember, either the CDC or WHO chart will only show you where your child would have plotted had they been included in the original data set.
We don’t actually know how your child compares to other children now, in 2022, and the comparison game doesn’t do us any favors anyway. Are your child’s biological parents short, tall, or average? Thin or fat? Then there’s a good chance your child’s measurements will be similar and that’s just fine. All bodies are good bodies!
Still, it’s helpful to have an ongoing record of your child’s growth. “These growth charts are a necessary part of well child visits,” says Lauren Crosby, MD, FAAP and Bobbie Medical Advisor. “They were designed to track a child’s growth and to identify any problems and, in most cases, they do help healthcare providers a great deal. Variations may be normal based on changes in the child’s diet, genetics or recent short-term health issues but variations could also mean that there is a disease process that needs to be considered.”
Biases of the Baby Growth Chart
Although the current CDC and WHO charts are an improvement over the original 1970s CDC charts, it’s important to note that the data sets these charts pull from still aren’t ideal. The racial makeup of the CDC charts reflect the U.S. population between 1963 and 1994, for example, and in the decades since, the proportion of the U.S. population identifying themselves as white has dropped by as much as 20%, according to census data.
Clinicians must also be careful not to use a child’s growth percentile as a proxy for their diet or a parent’s feeding practices. At ages 2 and above, children are classified as “overweight” when their growth lands between the 85th and 95th percentile on the BMI-for-age charts and “obese” at the 95th percentile and above. This often leads to harmful conversations in the pediatrician’s office about limiting or restricting a child’s diet in order to shift the child’s percentile, even when the child has been growing according to their own curve all along and may simply have a genetic predisposition towards a larger body. And even though BMI-for-age measurements are not used in infancy, the mentality that anything over the 85th percentile is undesirable is hard to avoid.
Pros and Cons of the Baby Growth Chart
What’s far more useful than trying to see how a child stacks up against their would-be peers of 30 years ago is following a child’s growth over time, no matter where they’re plotting.
“Growth charts can be incredibly helpful in allowing pediatric medical physicians to view and study the normal patterns of growth but also in detecting pathological deviations like poor weight gain due to medical causes”, says Dr. Husain. “It can also help prevent unnecessary evaluation of a child with acceptable normal variations and growth. I usually tell parents that the growth velocity or change in weight or height over time is a more sensitive indicator of growth rather than one single measurement. We like to see the trend rather than a single point in time.”
Typical growth expectations for healthy boys and healthy girls
Over age 3, we typically see that children settle into a steady growth pattern and continue plotting along the same curve. Outside of puberty, when a growth pattern shift is common, a jump or dip across percentile lines can very well represent something to investigate further, such as a chronic illness, a source of stress in the child’s life or a potential eating disorder.
Yet under age 3, pediatric growth can quite often change from one percentile line to another without cause for alarm as children experience growth spurts and settle into a feeding pattern. And measurements tend to be especially inconsistent from ages 0 to 12 months.
Do breastfed babies gain weight slower?
Both Dr. Crosby and Dr. Husain identify a change in feeding methods, typically from breastfeeding to formula feeding, as the most common reason for an infant’s measurements to change percentiles. “Though both breast-feeding and formula feeding provide the essential nutrients infants need to grow and thrive, there are some differences in weight gain patterns between these two groups,” says Dr. Crosby. “Usually a jump in percentiles is not a big worry, but it’s something to discuss and figure out if it’s okay for your baby or not.”
Sometimes an infant’s initial measurements are related to an issue with the mother’s pregnancy (did she reach 35 weeks or 40 weeks, for example?) or the amount of fluid the child retained from use of intravenous fluids administered to the mother during labor.
In fact, consistently measuring at the same percentile line from birth to 12 months is likely to be the exception rather than the norm. One 2014 study of over 9,000 children found that only 27% of infants consistently measured at the same percentile on the CDC charts across the first 12 months of life. Weight decreases were far more common, with 44% of children measuring at a lower percentile than they started at by 12 months.
Baby size by week
The CDC and WHO charts go by month. They are the same charts each time and anytime a measurement is recorded it’s plotted at the corresponding spot on the chart. At each pediatrician’s visit, the doctor will check percentile for weight, how many inches long, head circumference, crown to rump and other important measuring data. Babies grow differently and they will chart the child growth.
Are baby growth charts out of date?
It’s logical for both clinicians and parents to seek a tool to either reassure ourselves that a child’s growth is just fine or alert us when something might be wrong. Indeed, as a practitioner I can attest that such a tool would be quite convenient! But the factors influencing human growth are just too complex to boil down exclusively to lines on a chart.
Instead, we need to combine growth chart data with what we know about the child’s genetics, gestational age at birth, lab values, parental feeding practices and more.
Utilizing growth chart data is not necessarily antiquated but rather one of many tools available to clinicians seeking to put together the entire picture and either design a supervised intervention or assure parents that the child’s growth is just fine.
“We also look at the past medical history, the dietary history, developmental history and any symptoms that the child may have including family history,” says Dr. Husain. “I think growth charts are a huge part of assessing growth, but I always remind parents that they aren’t the ONLY aspects we rely on.”
How growth charts affect parents’ mental health
It turns out that growth charts may not be particularly valuable to parents. A 2009 survey of 1,000 parents found that although the majority of respondents believed that seeing growth chart data was an important element of understanding their child’s growth, up to 77% of parents interpreted growth chart data incorrectly.1
“Parents often do not understand what the data from a growth chart indicates, which can definitely cause them a lot of anxiety,” says Dr. Crosby. “The minute I present the numbers and show the growth chart, I give a reassuring explanation right away which tends to prevent a lot of anxiety.”
How growth charts cause anxiety
With the 2014 study finding only 27% of children staying on the same curve as their birth measurements, that leaves close to three quarters of parents potentially worried about their children growing either too large or too small. Such concerns don’t only influence the parent’s mental health. Concern about an infant’s weight, whether large or small, founded or unfounded, has been repeatedly associated with non-responsive feeding practices including pressuring the infant to eat more than they are hungry for or restricting the child’s intake.2
Implications to the child later in life may include poor self-regulation with food, unnecessary weight gain and a poor relationship with food.
Conclusion: Things to look out for and when to speak to your pediatrician
Growth charts are a clinical tool that is useful in infancy and becomes increasingly more valuable as infants become children. Although there is plenty of room for improvement in terms of the data sets the charts are based on and how practitioners relay the relevance of a growth chart measurement to parents, I certainly wouldn’t want to see them abandoned altogether.
I believe growth charts in infancy are the beginning of a data set that will become much more useful as a child ages and settles into whatever growth pattern is right for them.
I encourage parents to forget all about how or whether their infant’s growth chart shows how the child “stacks up” against other children of the same age. Outside of supervised, clinically-necessary feeding interventions (such as a feeding tube or offering concentrated formula) or medical treatment for a genetic condition influencing growth, there is very little that a parent can or should do to influence a child’s growth in either direction.
Let’s feed our infants on demand and as directed by your child’s pediatrician and give them the opportunity to satisfy their appetites regardless of where they’re plotting on a chart. That’s exactly how to give a child all the nutrition they need, teach them to honor their appetites and set them up for a lifetime of having a healthy relationship with food and their bodies.
Sources:
- Do Parents Understand Growth Charts? | AAP
- Associations between infant and maternal characteristics measured at five months | NIH